- Welcome
- Getting started
- Latest updates
- Foundations
-
Components
- Accordion
- Alert
- Alignment
- App Search Modal
- Aria live
- Autosuggest
- Badge
- Banner alert
- Bar chart
- Blockquote
- Bottom navigation
- Bottom sheet
- Breadcrumb
- Breakpoint
- Button
- Calendar
- Card
- Card list
- Card button
- Carousel
- Checkbox
- Chip
- Chip group
- Code
- Content cards
- Data Table
- Datepicker
- Description list
- Dialog
- Divider
- Drawer
- Field Set
- Flare
- Flat list
- Flight leg
- Floating action button
- Floating notification
- Form label
- Form validation
- Graphic promotion
- Horizontal navigation
- Icon
- Image
- Image Gallery
- Infinite scroll
- Info Banner
- Inset Banner
- Link
- List
- Map
- Mobile scroll container
- Modal
- Navigation bar
- Navigation Tab Group
- Nudger
- Overlay
- Page indicator
- Pagination
- Panel
- Phone input
- Picker
- Popover
- Price
- Progress bar
- Radio button
- Rating
- Rating Bar
- Scrollable calendar
- Search Modal
- Section header
- Section list
- Select
- Skeleton
- Skip link
- Slider
- Snackbar
- Snippet
- Spinner
- Split input
- Star rating
- Swap Button
- Switch
- Table
- Text
- Text input
- Theming
- Ticket
- Toast
- Tooltip
- Touchable native feedback
- Touchable overlay
- Search Input Summary
- Content
- Accessibility
- Contributing
- Localisation
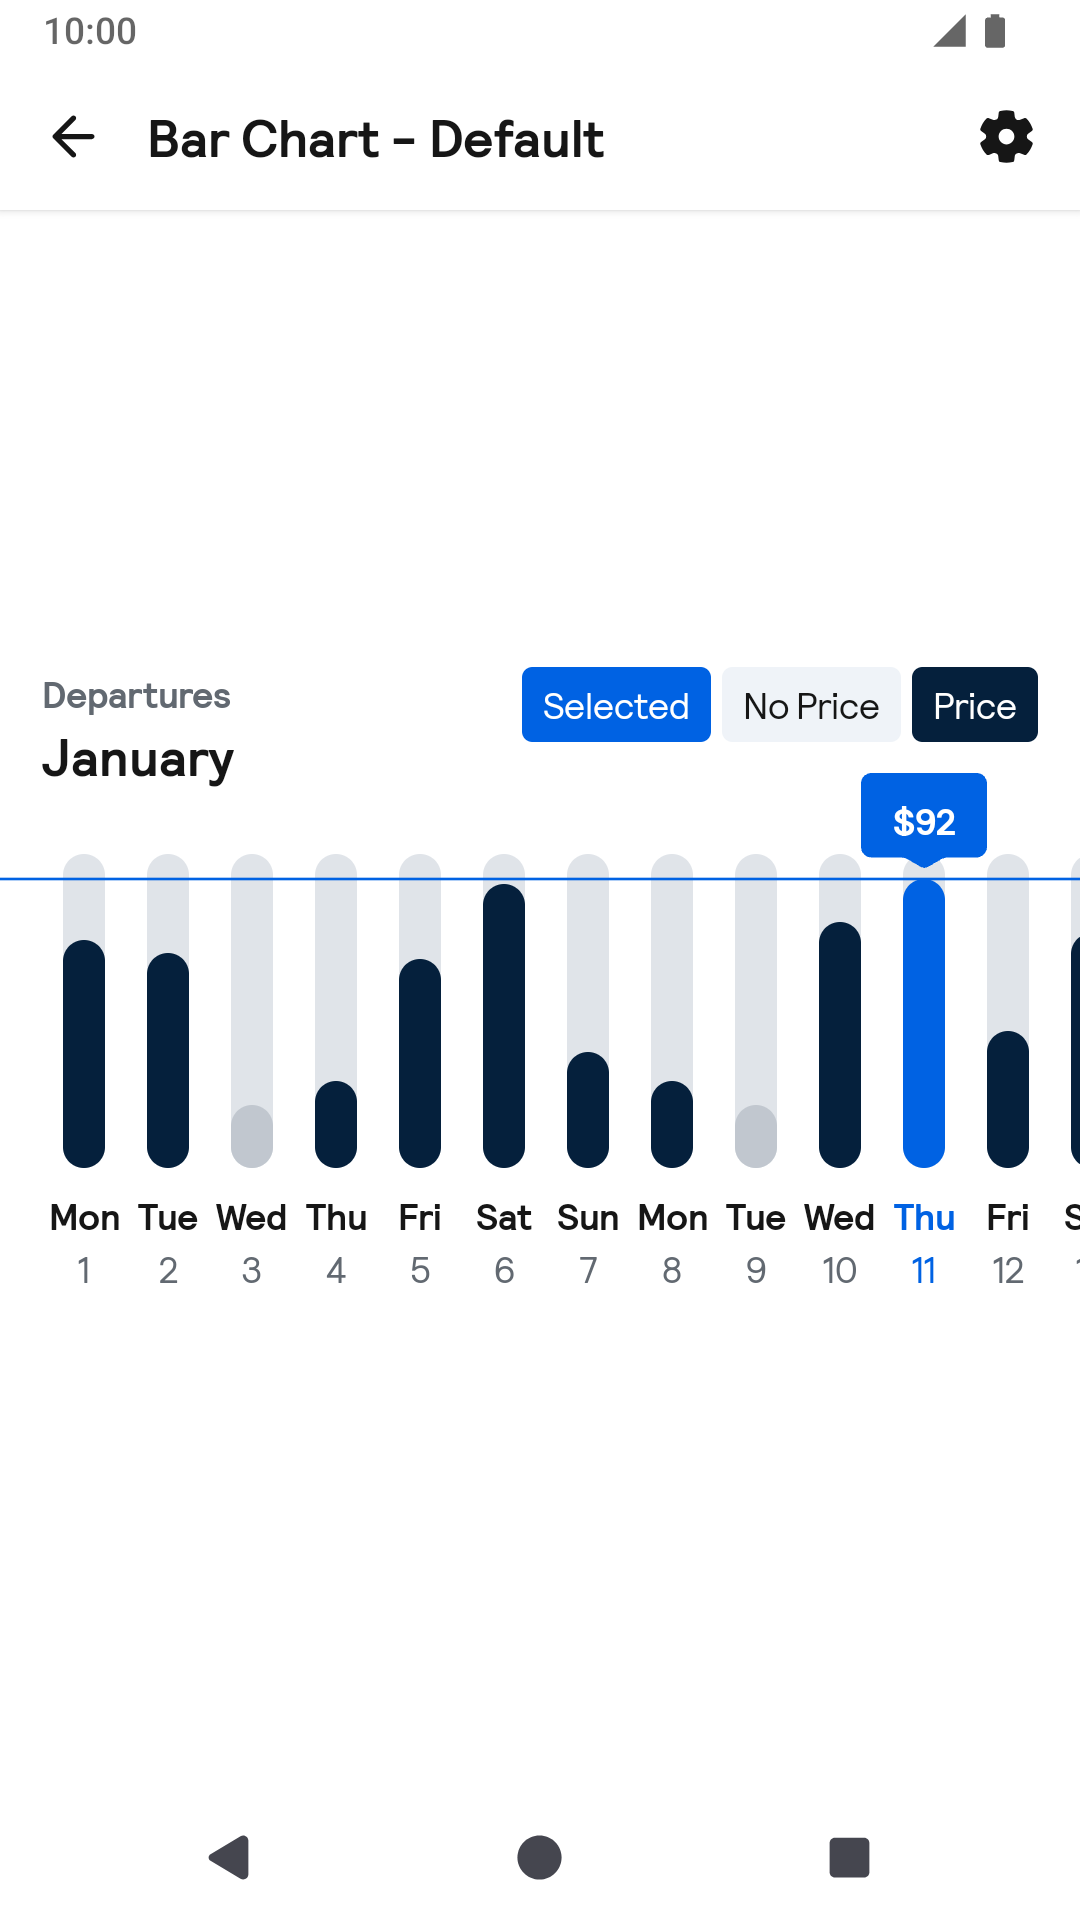
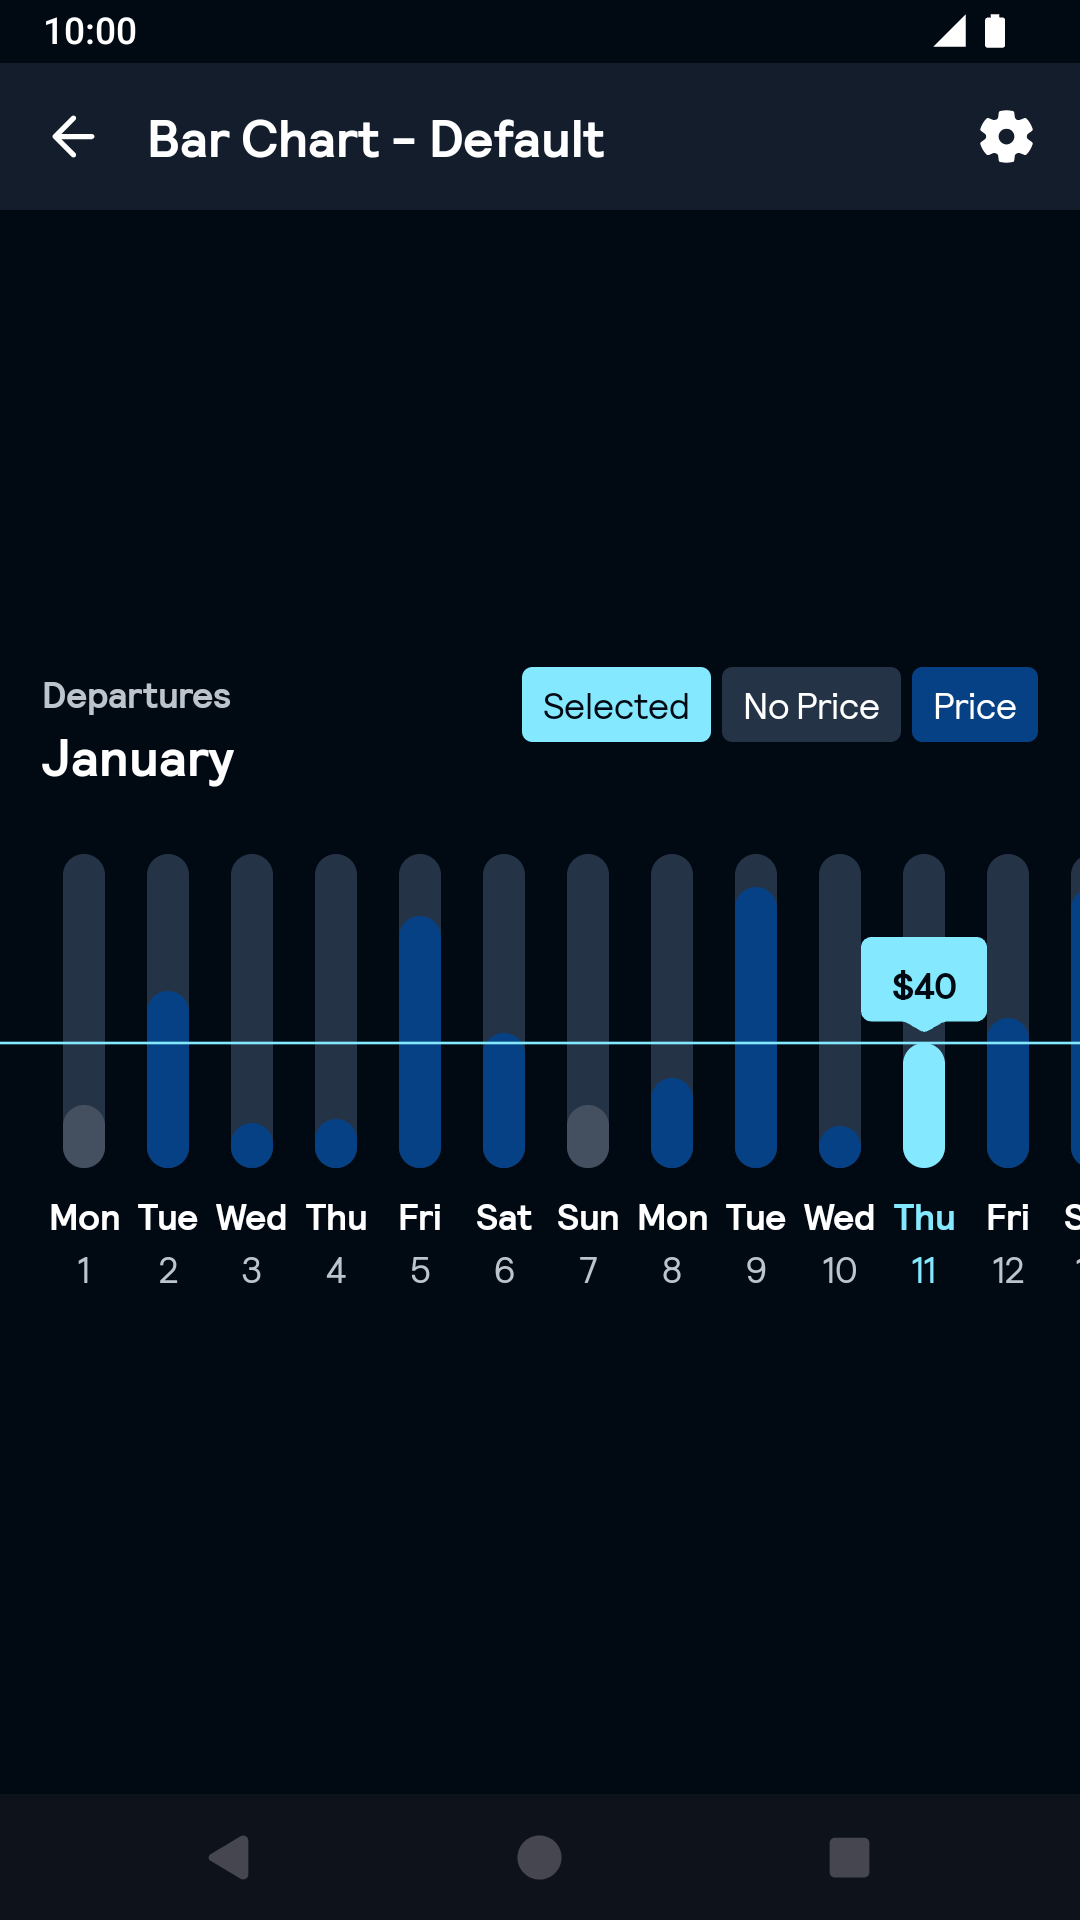
Bar chart
Bar charts are useful for displaying comparisons between categories of data. At Skyscanner, bar charts are commonly used for displaying fare prices within a given time period e.g. a year, month or week.
BarChart

Default
| Day | Night |
|---|---|
 |
 |
Installation
Backpack Compose is available through Maven Central. Check the main Readme for a complete installation guide.
Usage
Example of a BarChart:
                                                import net.skyscanner.backpack.compose.barchart.BpkBarChart
                                                import net.skyscanner.backpack.compose.barchart.BpkBarChartModel

                                                val model = createBarChartModel() // see docs below

                                                var selectedItem by remember { mutableStateOf<BpkBarChartModel.Item?>(null) }

                                                BpkBarChart(
                                                  model = model,
                                                  selected = selectedItem,
                                                  onSelectionChange = { selectedItem = it },
                                                )
To render data you need to create a model for BarChart in code. Detailed documentation on each property of the model is available here.
Here's an example which generates a model for one single month in Kotlin:
                                                import net.skyscanner.backpack.compose.barchart.BpkBarChartModel
                                                import org.threeten.bp.LocalDate
                                                import org.threeten.bp.YearMonth
                                                import org.threeten.bp.format.TextStyle
                                                import java.util.Locale

                                                fun createBarChartModel(locale: Locale, yearMonth: YearMonth) =
                                                  BpkBarChartModel(
                                                    caption = "Bar chart caption",
                                                    legend = BpkBarChartModel.Legend(
                                                      selectedTitle = "Selected",
                                                      inactiveTitle = "No price",
                                                      activeTitle = "Price",
                                                    ),
                                                    items = List(yearMonth.lengthOfMonth()) { day ->
                                                      val date = LocalDate.of(yearMonth.year, yearMonth.month, day + 1)
                                                      BpkBarChartModel.Item(
                                                        key = date, // unique id of a specific bar – date in this case
                                                        title = date.dayOfWeek.getDisplayName(TextStyle.SHORT, locale),
                                                        subtitle = date.dayOfMonth.toString(),
                                                        group = date.month.getDisplayName(TextStyle.FULL, locale), // title of the current list section
                                                        values = BpkBarChartModel.Values(
                                                          // null if not selectable
                                                          text = "£42", // text to be displayed when selected,
                                                          percent = 0.5f, // fill bar by 50%
                                                        ),
                                                        // provides accessibility information here to be used with screen readers
                                                        // make sure it's formatted properly and includes all the relevant information needed (title, subtitle, text value, group)
                                                        // the example below is just for general purposes
                                                        contentDescription = "Monday the 7th of January, price is £142",
                                                      )
                                                    }
                                                  )
Made with ❤️ by Skyscanner © 2024
© 2024 Skyscanner Backpack. Page last updated on Dec 22, 2022, 09:35